<style type="text/css"> .reveal h3 { text-align: left; } .reveal p { text-align: left; } .reveal ul { display: block; } .reveal ol { display: block; } </style> ## How to Buy the Dip #### A Trading Strategy from One Sentence --- #### Be greedy when others are fearful > You want to be greedy when others are fearful. You want to be fearful when others are greedy. > > [-- Warren Buffett](https://en.wikiquote.org/wiki/Warren_Buffett) --- ## How to Judge Fear? --- VIX Index 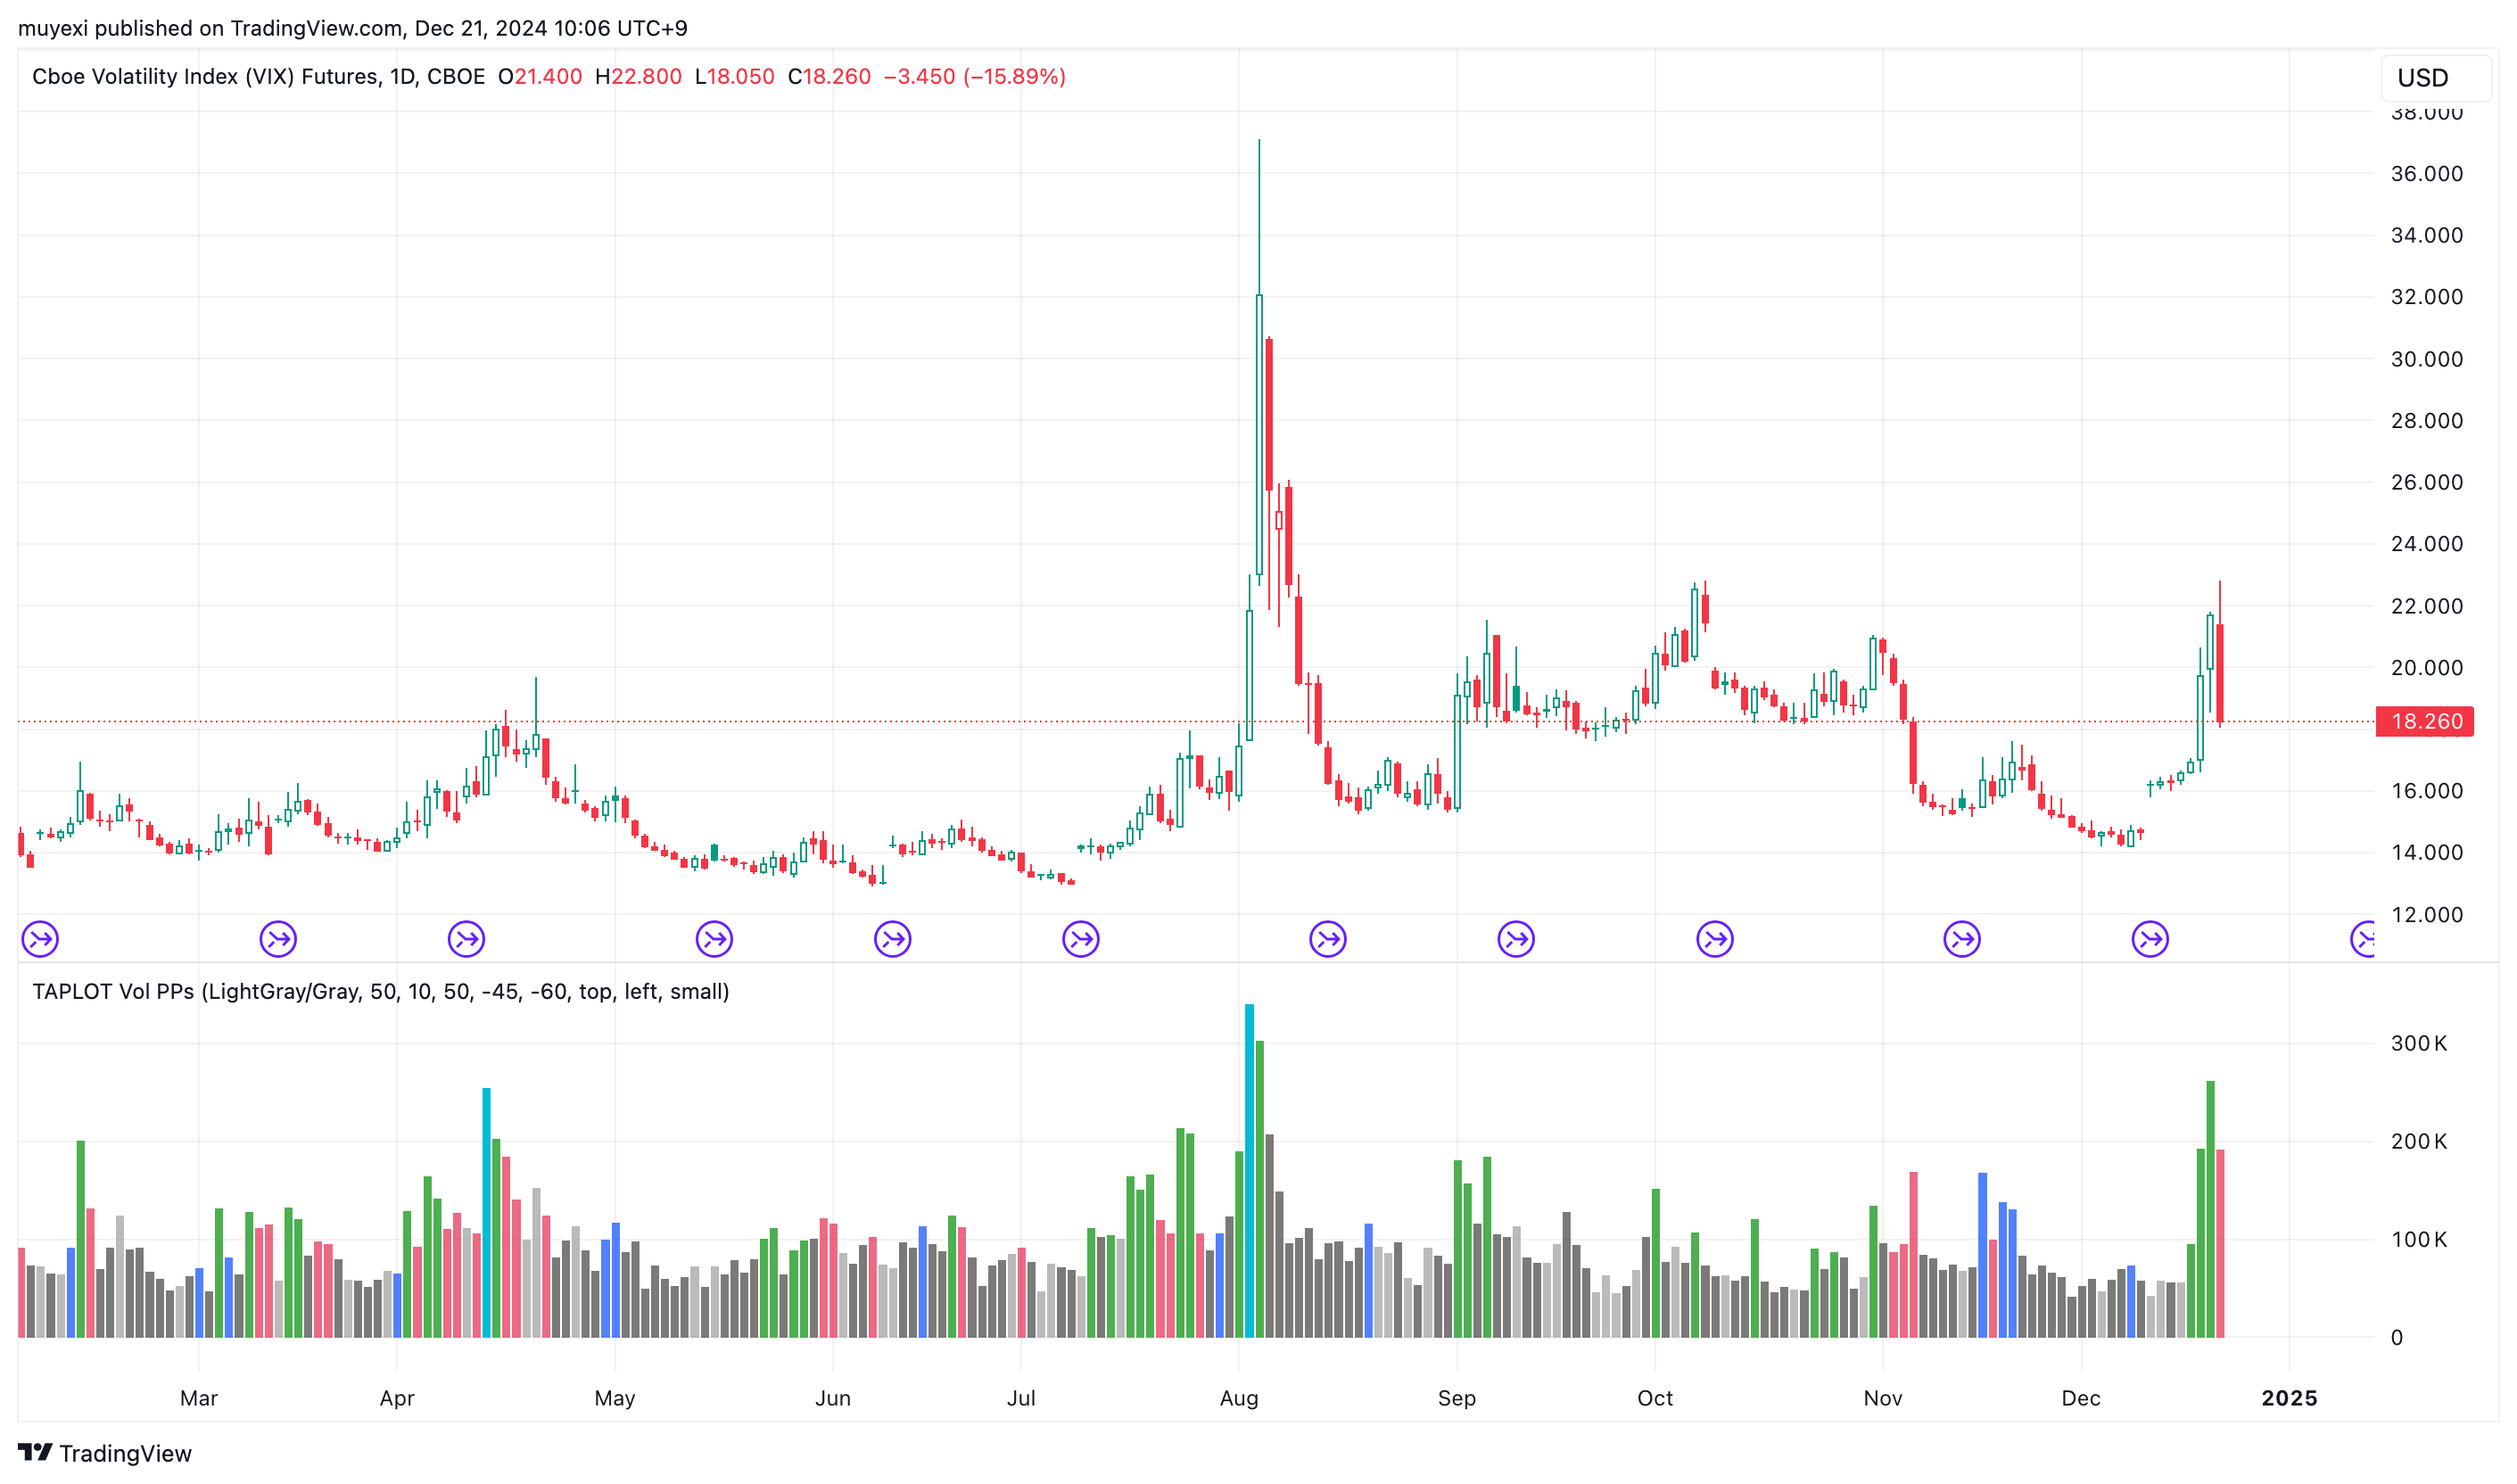 --- **Features of the VIX Index:** 1. Calculation: VIX is derived from the options market. 2. Inverse Correlation: VIX usually moves in the opposite direction to the S&P 500. 3. Volatility: High volatility, sharp rises and slow declines, event-driven. 4. Mean-Reverting: But the “mean” itself is dynamic and influenced by market conditions. --- **Market Breadth Indicators** Tools used to measure the ratio of advancing to declining stocks or the overall market participation, aiming to reflect the overall health of the market rather than just index performance. --- **[Barchart Market Breadth Indicators](https://www.barchart.com/stocks/indices/sp/sp500)** 1. S5TW: % of stocks above their 20-day moving average – reflects short-term market health. 2. S5FI: % above the 50-day average – reflects medium-term market health. 3. S5TH: % above the 200-day average – reflects long-term market health. <br> **Key Feature**: Oscillatory in nature, values range from 0% to 100%. --- $S5TW(S&P 500 Stocks Above 20-Day Average) 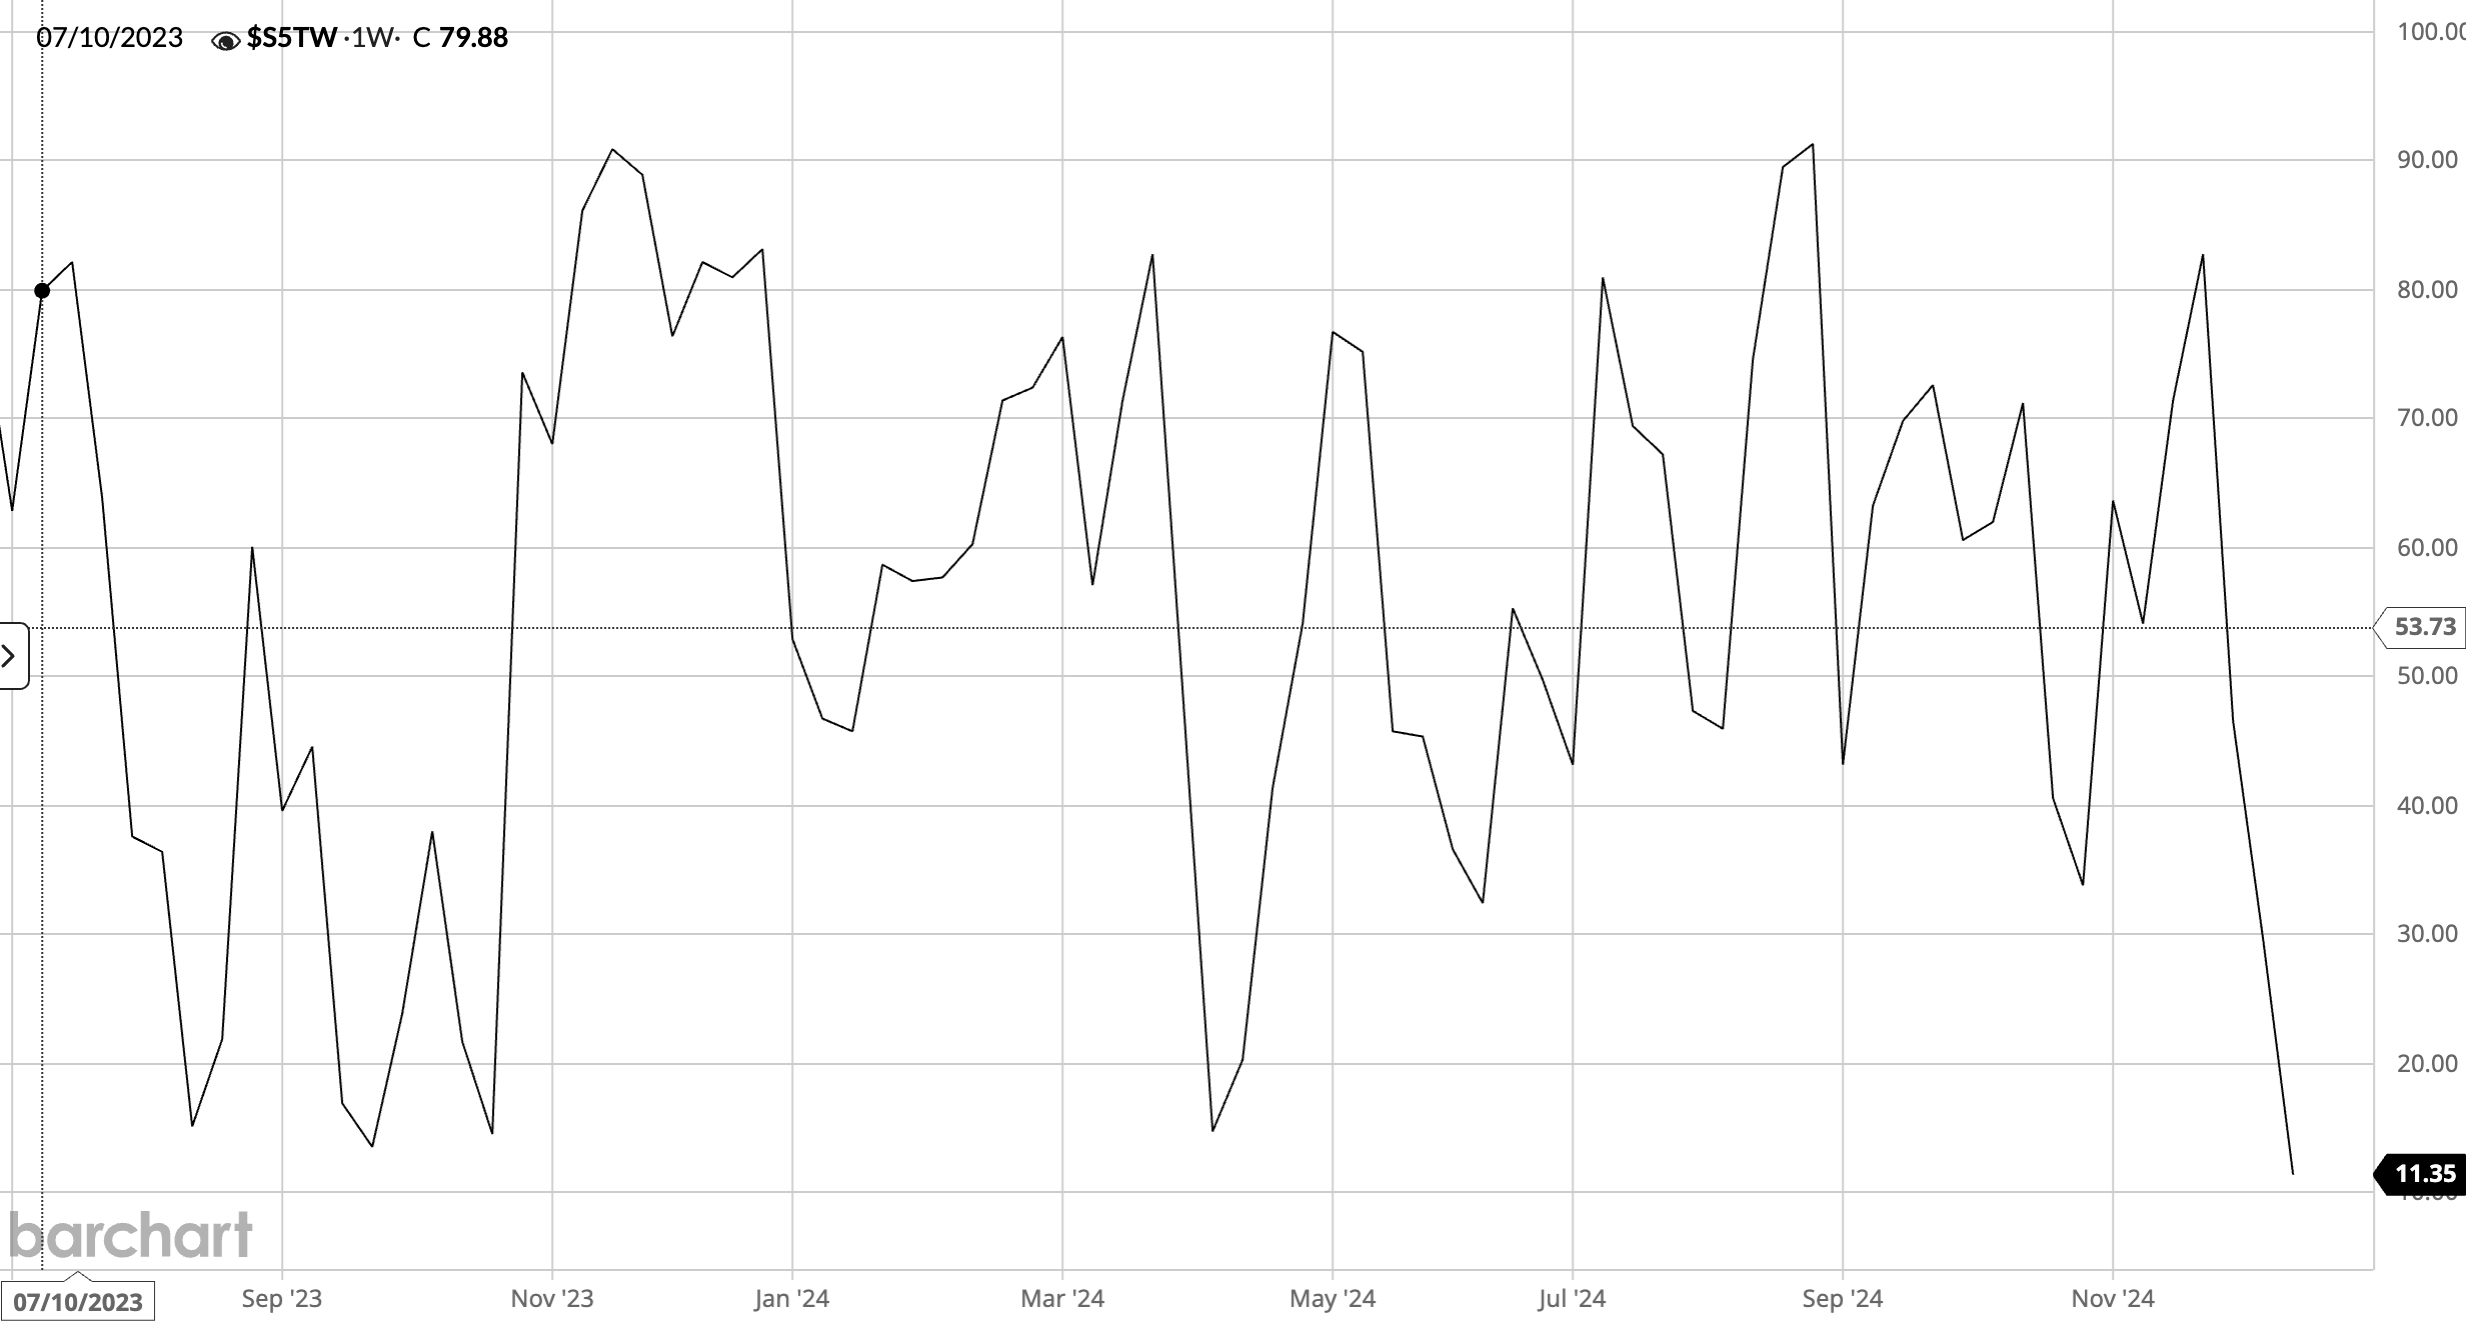 --- **Features of Barchart Breadth Indicators:** 1. Oscillatory: Range from 0% to 100%. 2. Divergence: When S5TW diverges from S&P 500 (e.g., S&P makes new highs but S5TW falls), it could signal internal market weakness. --- **Comparison of the Three Breadth Indicators**  --- **Breadth Indicators vs VIX** 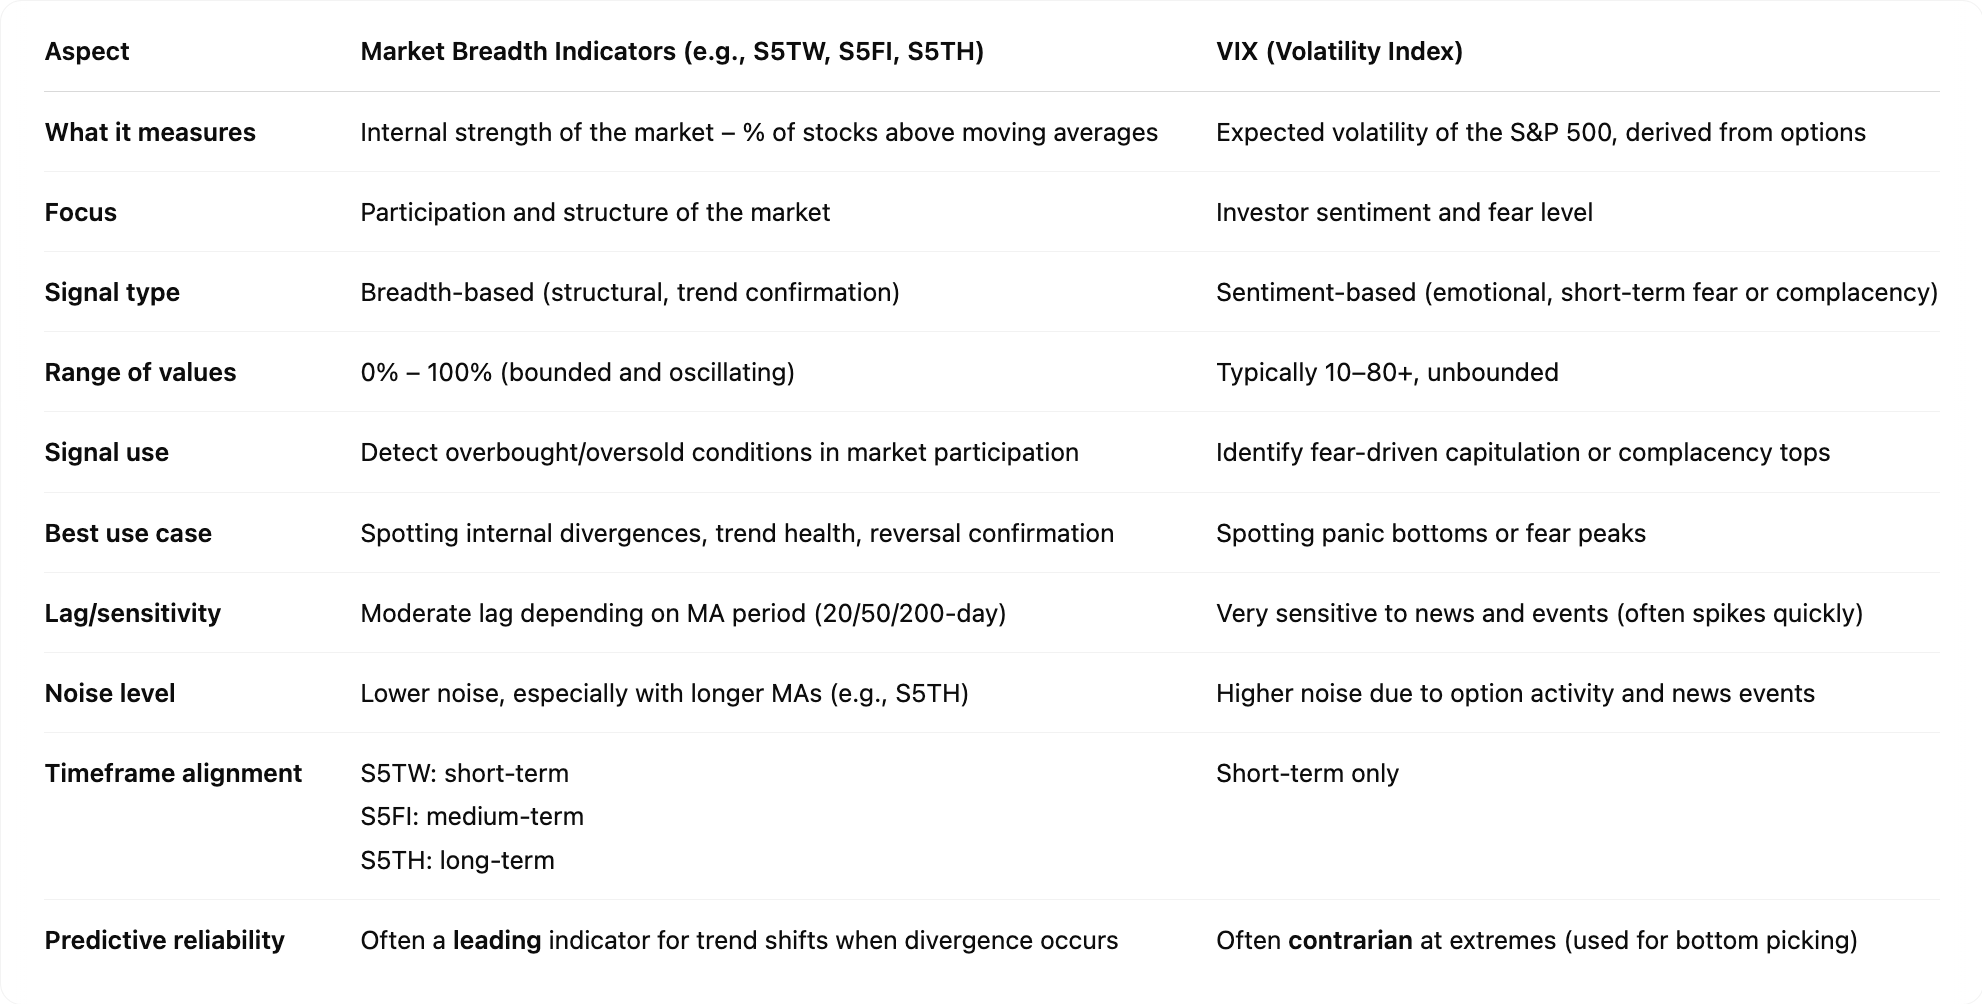 --- **Current Market Breadth** 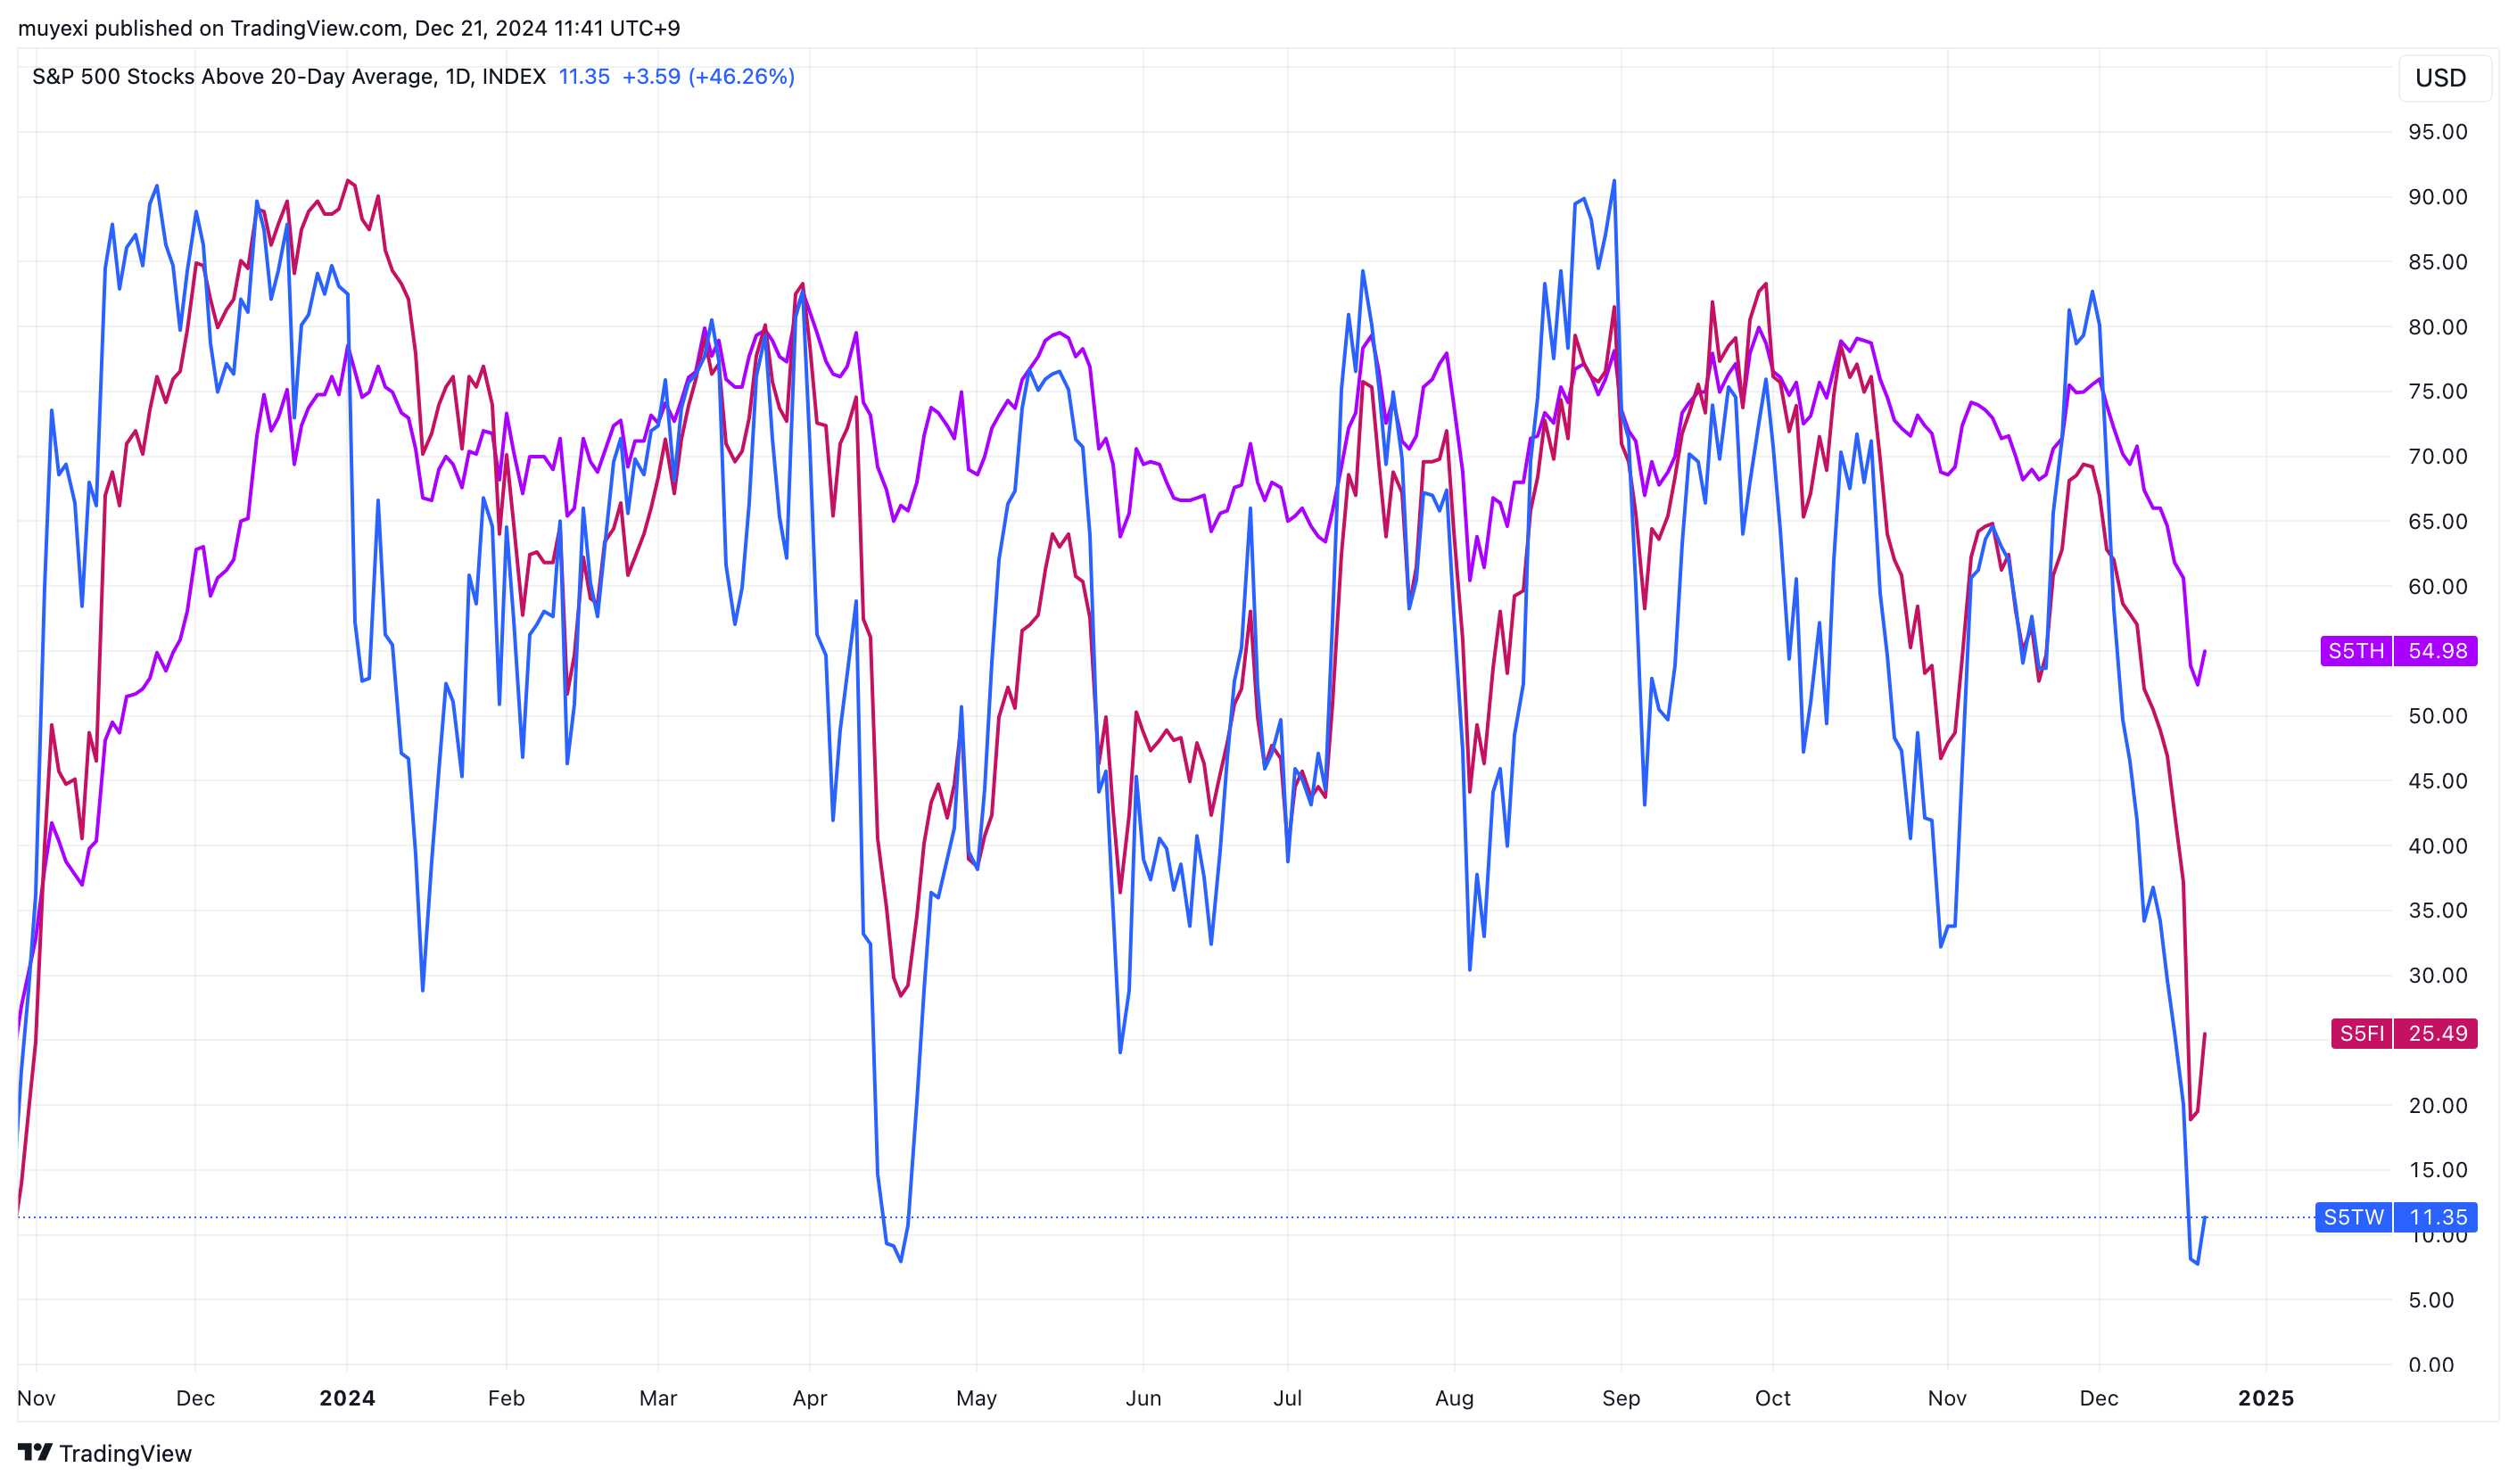 --- **SPX vs Breadth** 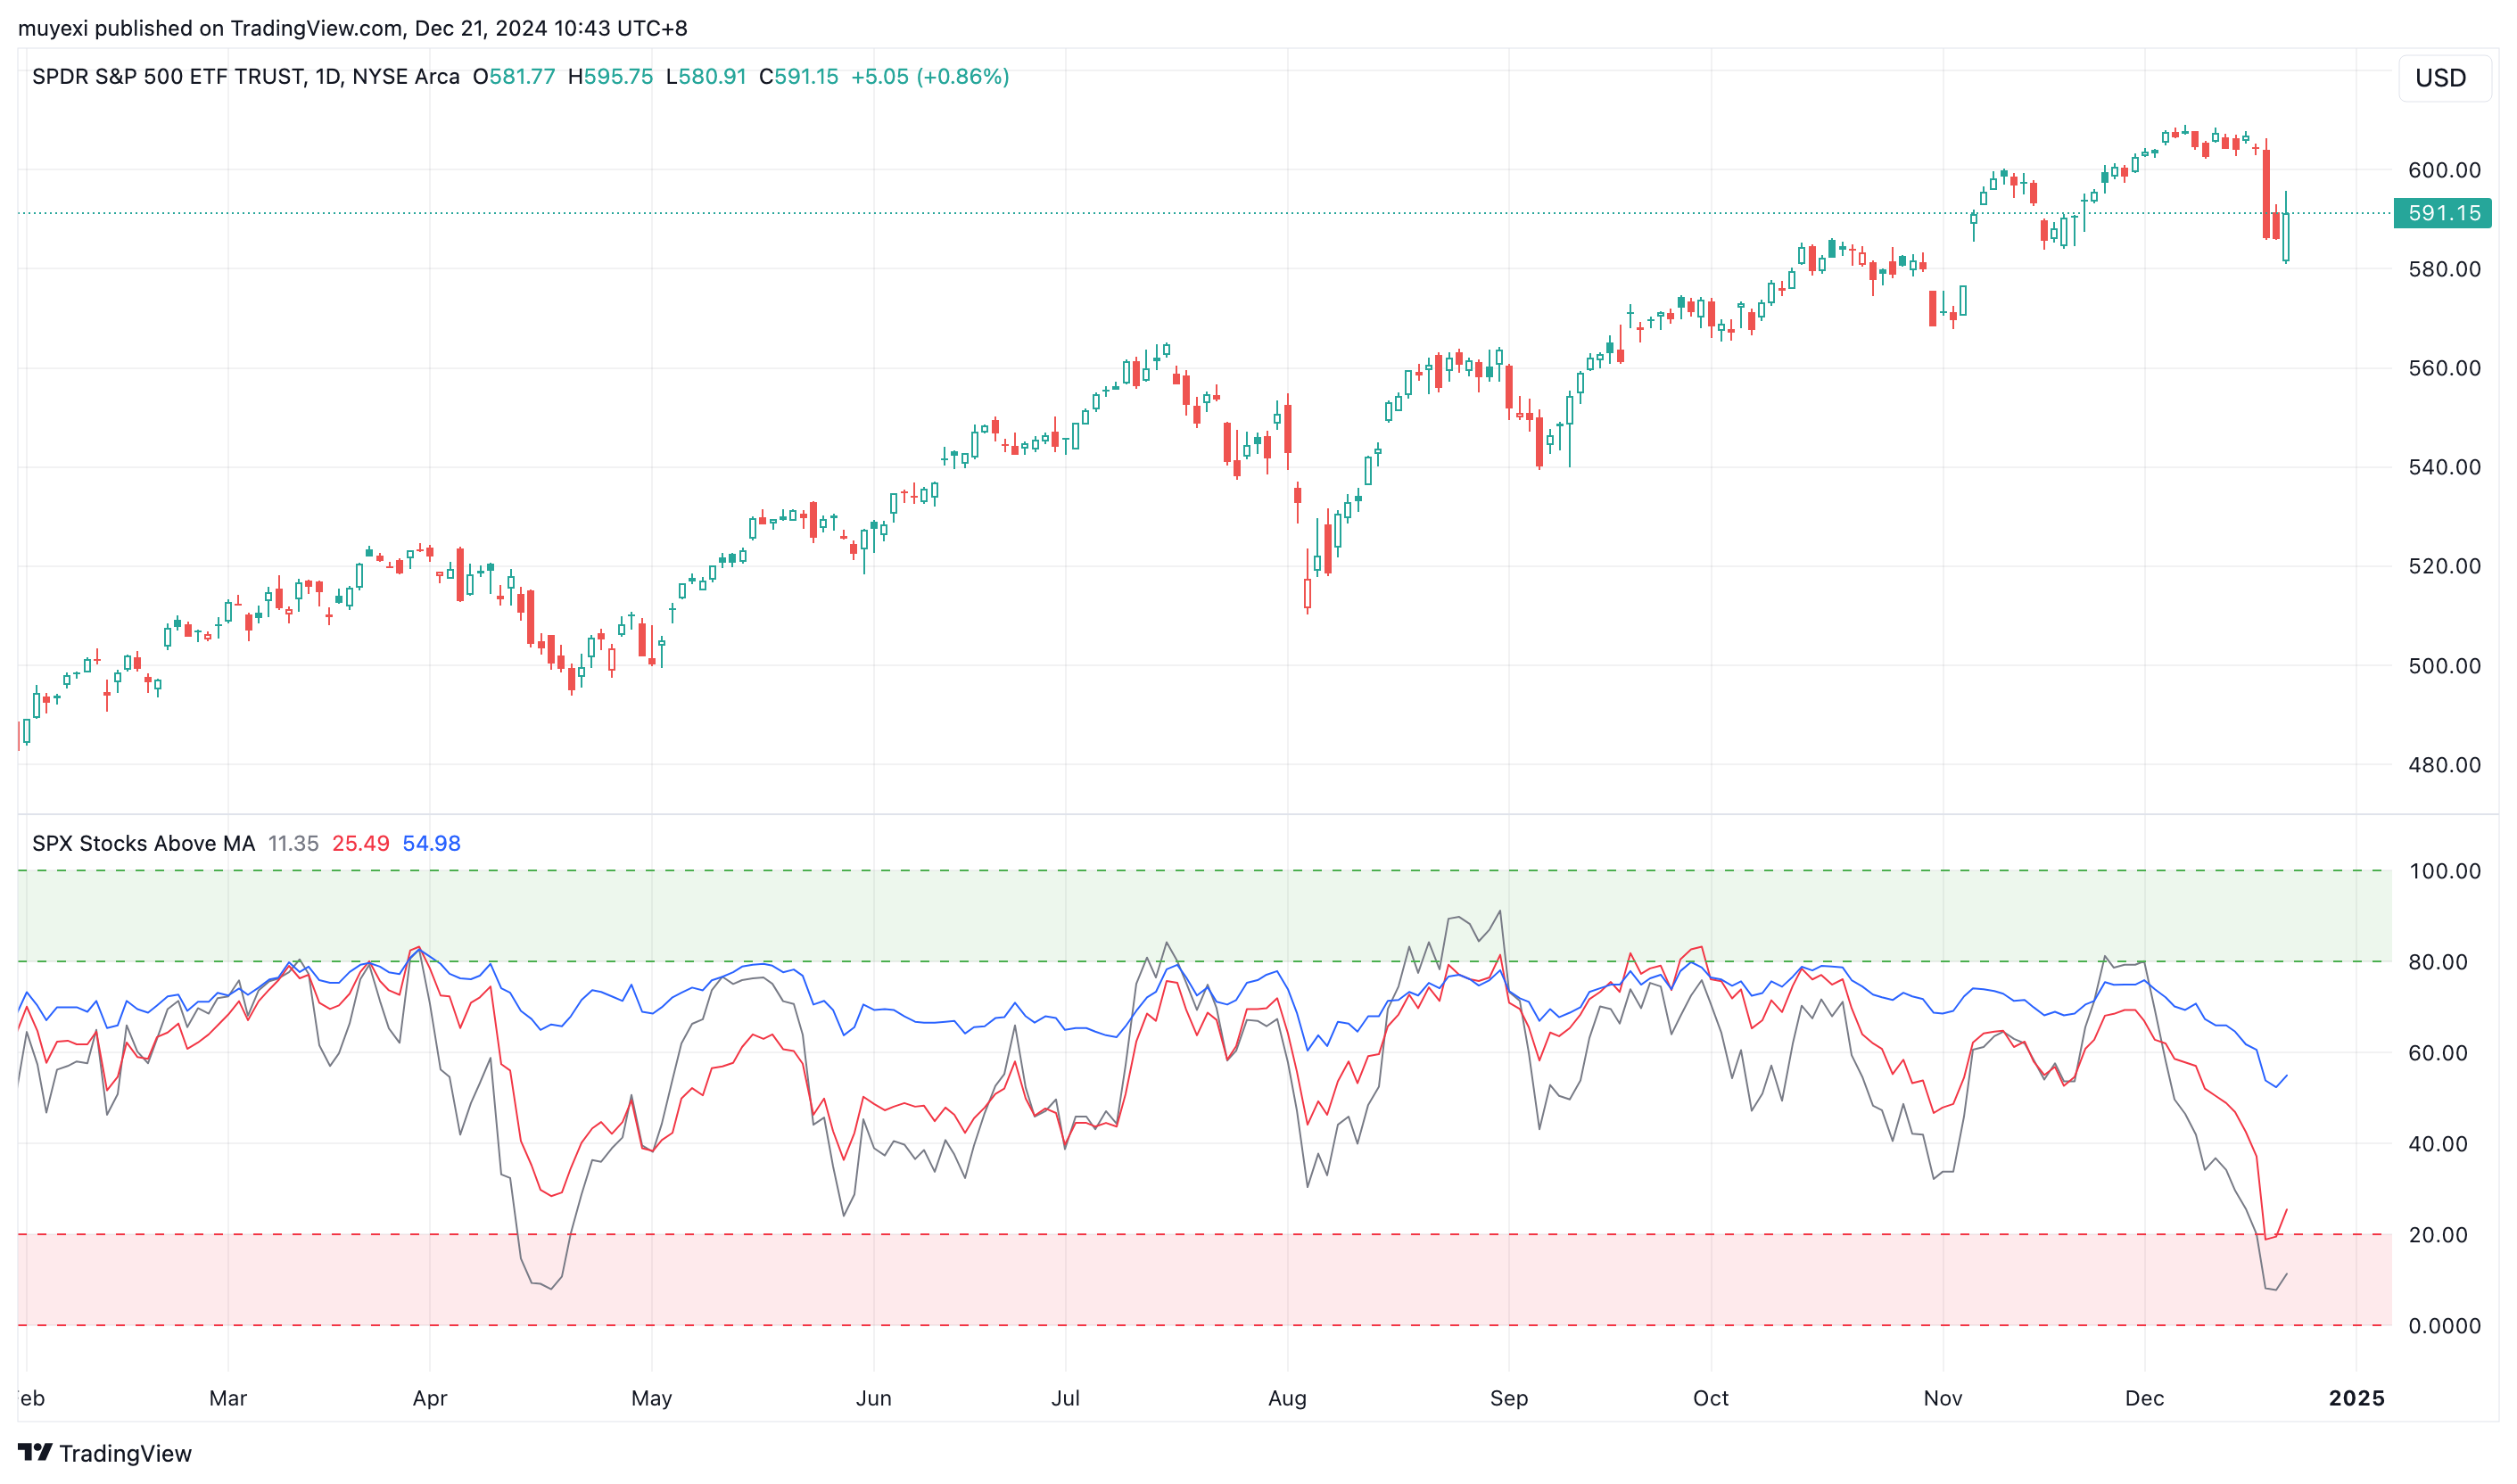 --- Market breadth indicators can help identify short-, medium-, and long-term market bottoms. --- ## What to Buy❓ # 🤔 --- 1. Broad Market Index ETFs 2. Sector Index ETFs 3. Individual Stocks --- ## How to Select Stocks at the Market Bottom❓ --- Why is the index at highs while short-term breadth is only at 20%? 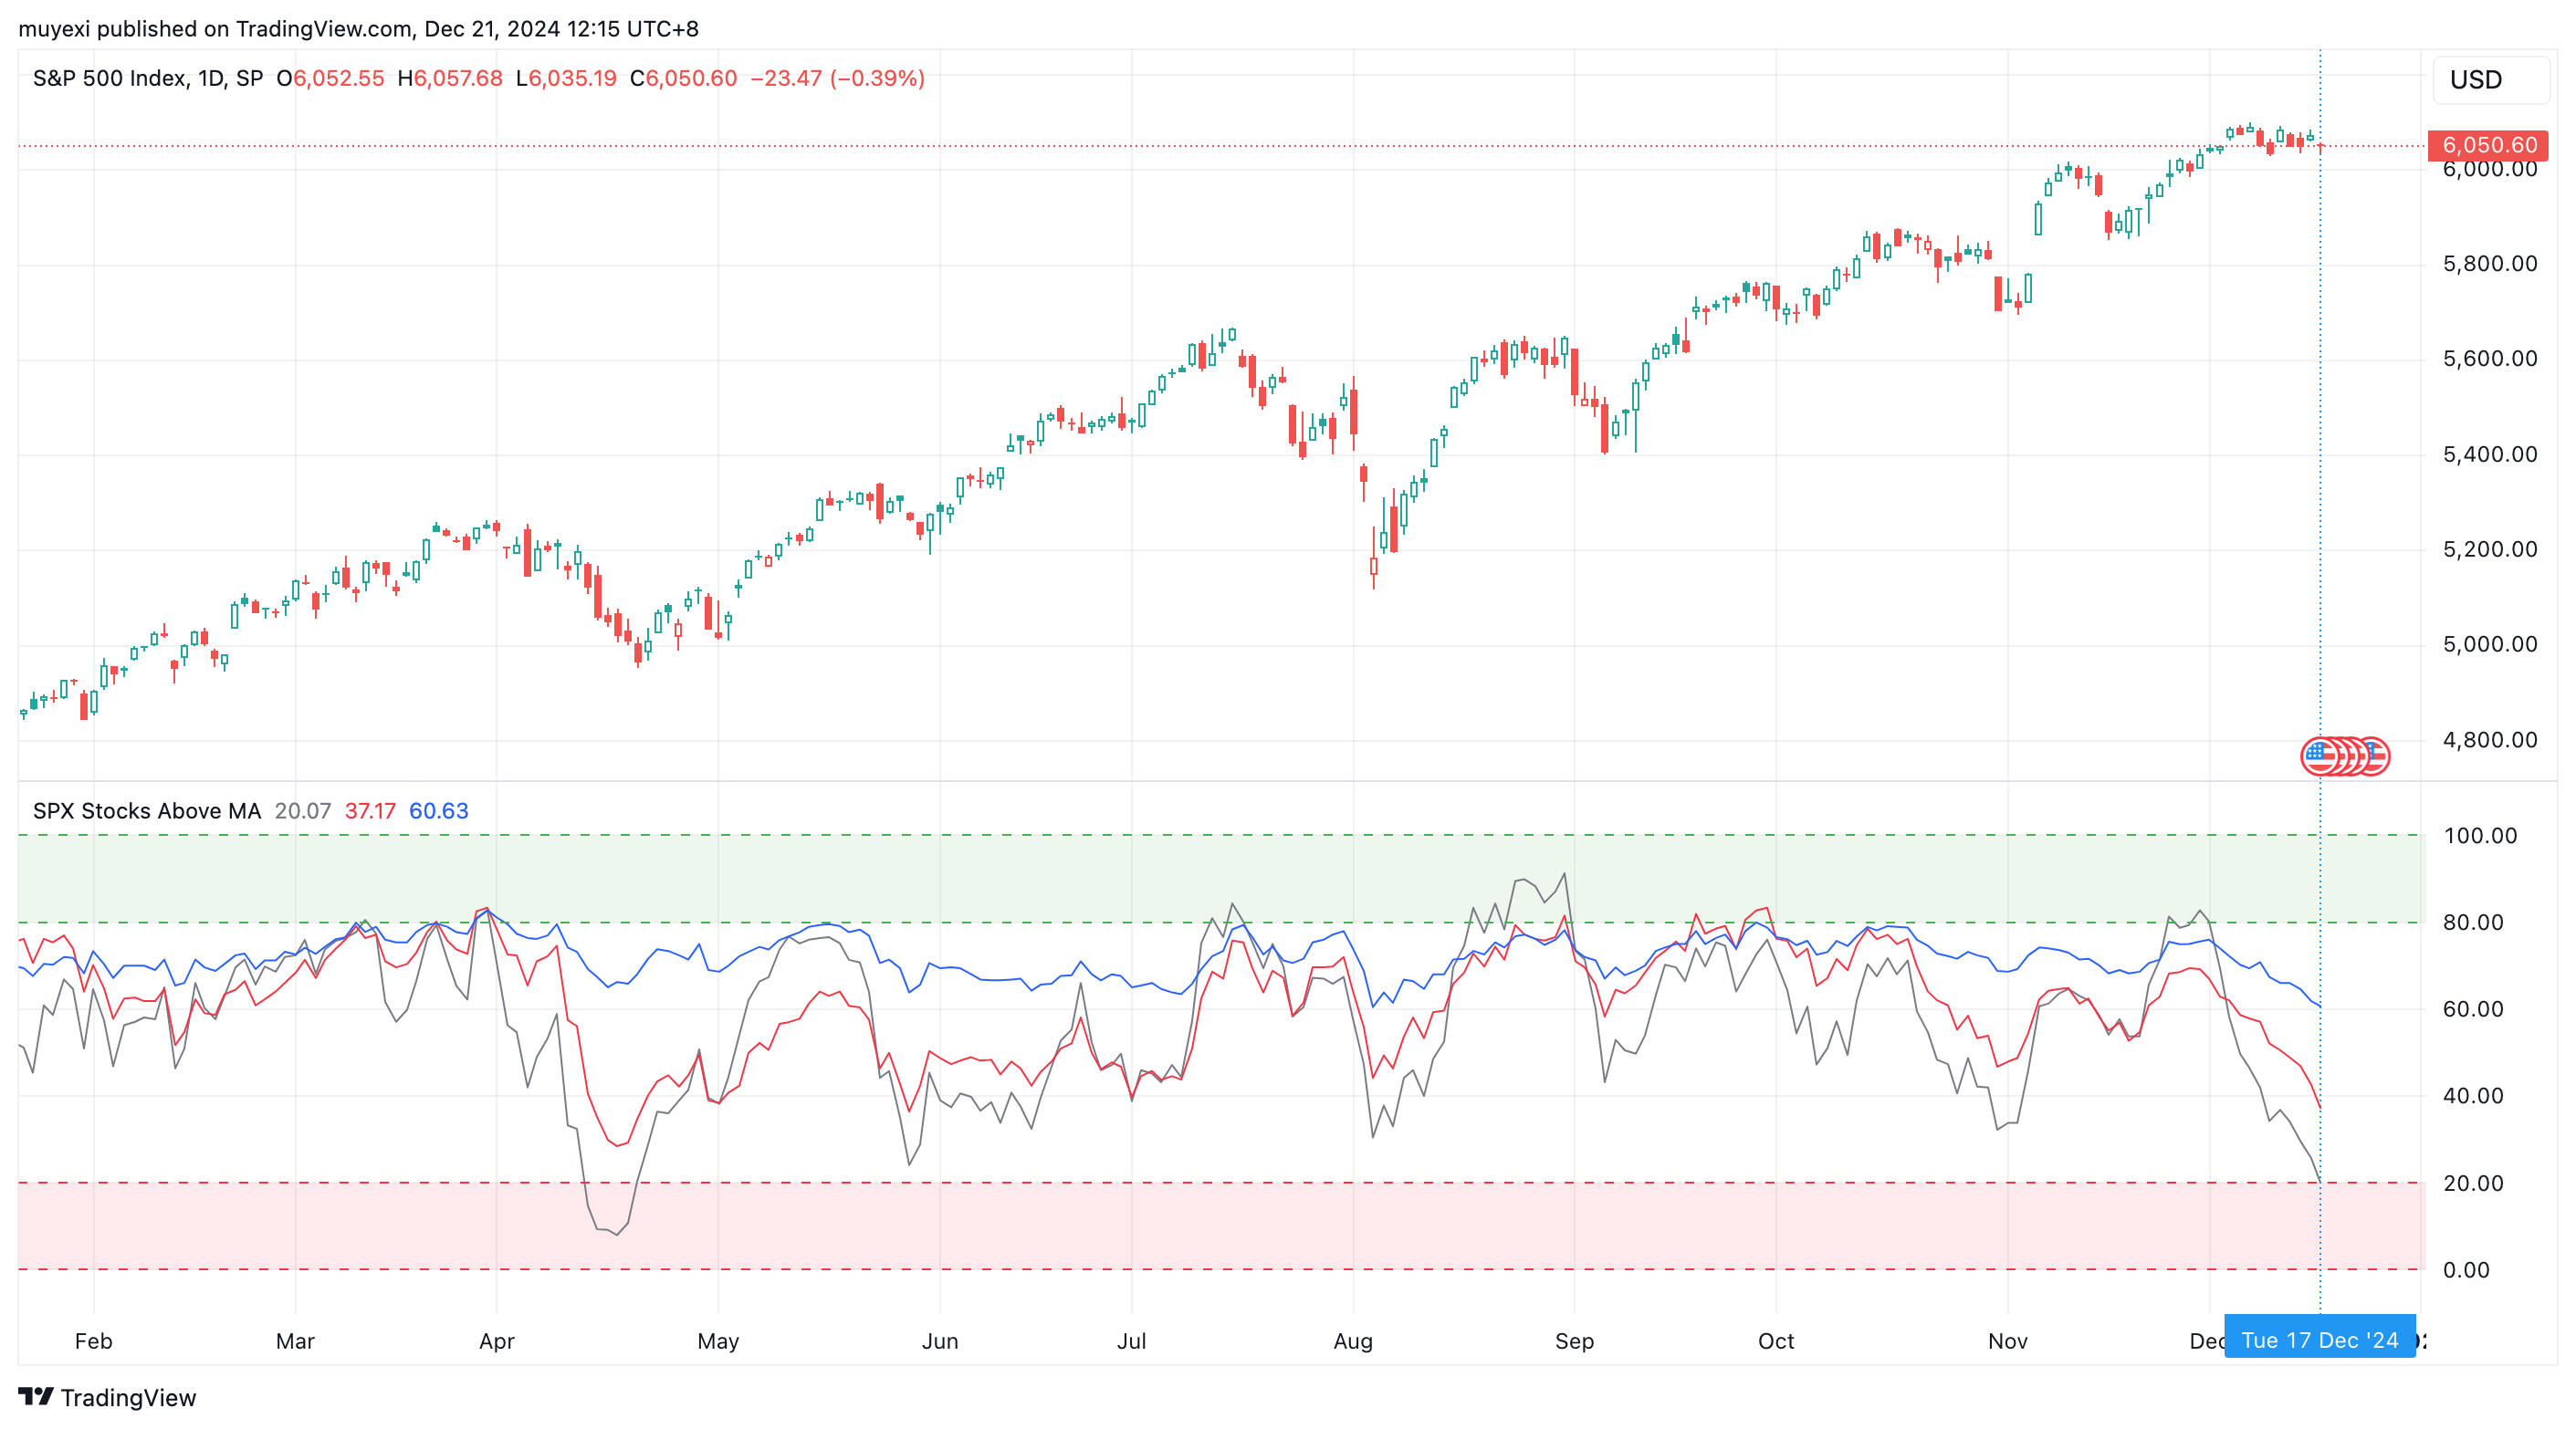 --- 1. The S&P 500 is market cap weighted. 2. 7 mega-cap tech stocks make up [32%](https://www.slickcharts.com/sp500/analysis)。 of the index. 3. The index is driven by a few large-cap stocks, showing significant market divergence. --- Equal-weighted Index:SPXEW 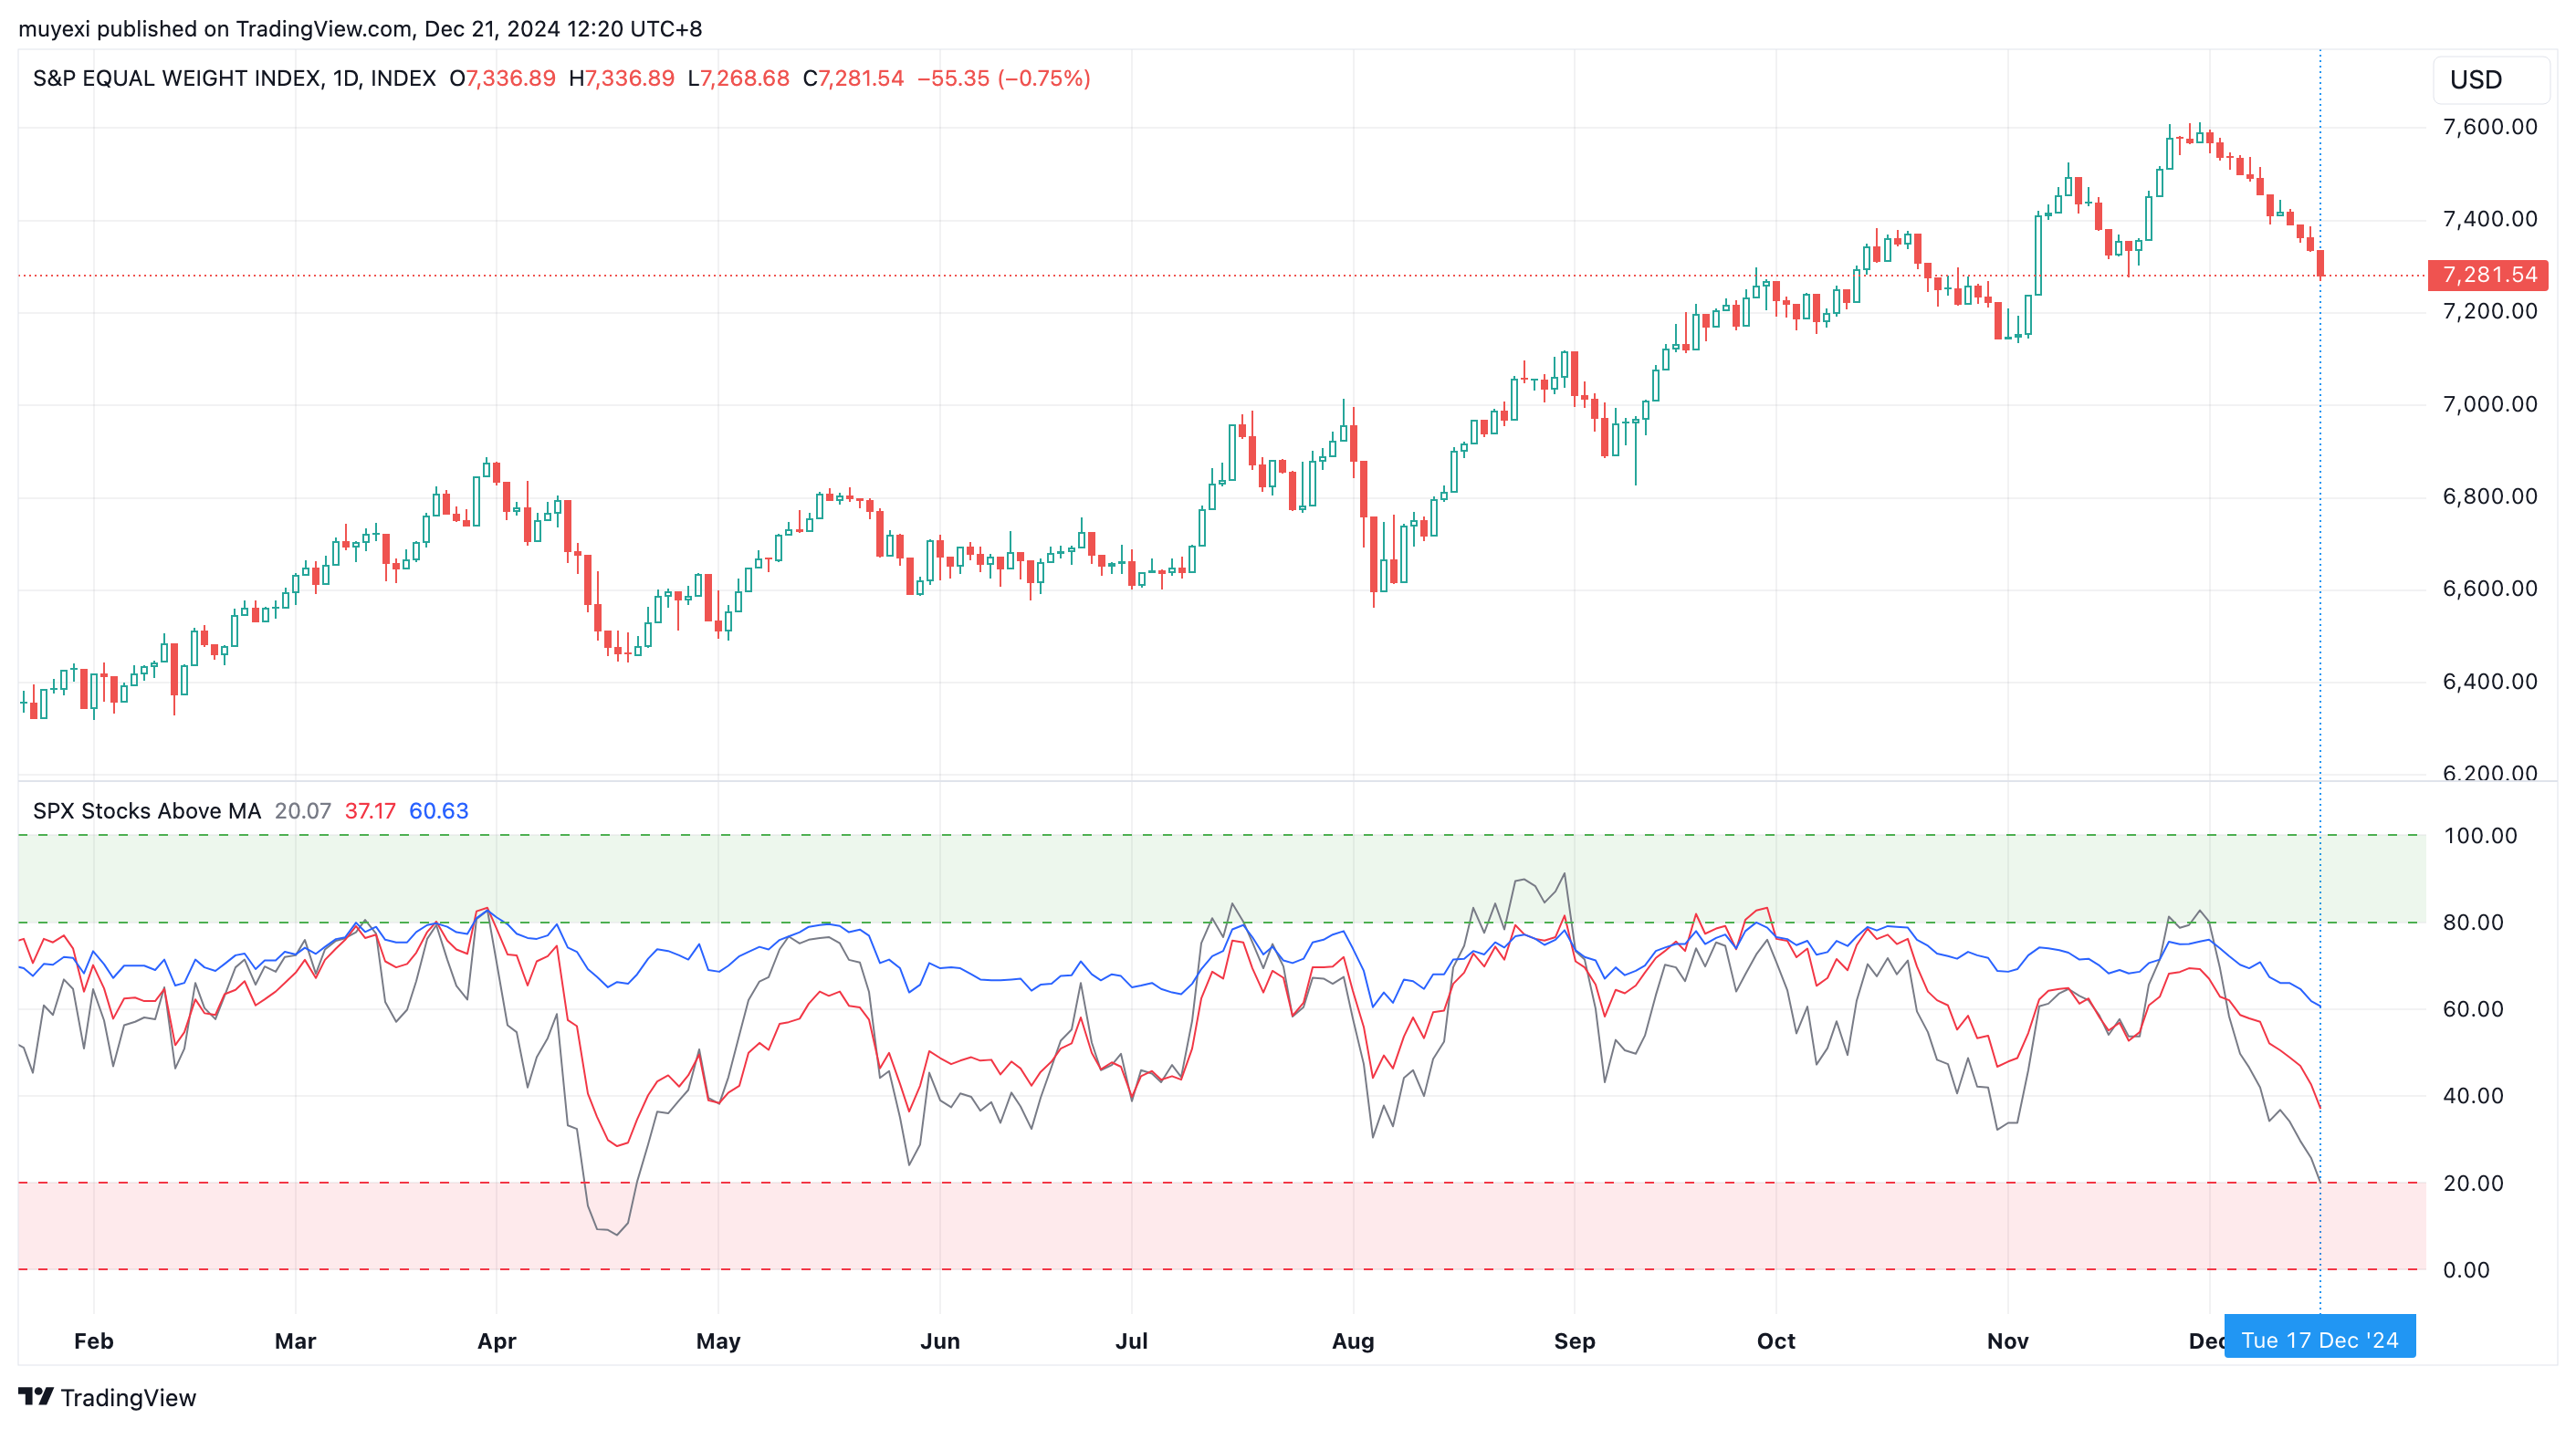 --- ### Stock Selection Matters! At market bottoms, it's easier to find strong stocks. --- ### Practice 1 Use TradingView to screen sectors. --- ### Practice 2 Use TradingView to screen individual stocks within sectors. --- ### Practice 3 Review sector and stock performance. --- #### The psychology of trading <iframe width="560" height="315" src="https://www.youtube.com/embed/zmxDxDDlaqU?si=f2eH9x5Eelxe7pjR" title="YouTube video player" frameborder="0" allow="accelerometer; autoplay; clipboard-write; encrypted-media; gyroscope; picture-in-picture; web-share" referrerpolicy="strict-origin-when-cross-origin" allowfullscreen></iframe> --- What's next: 1. Review historical market bottoms and [write an article](https://muyexi.im/mei-gu-xiang-dui-qiang-ruo-fu-pan-2023-10-27/). 2. Wait…… --- ## Any questions?